
Possible breach of resistance level by Italy 40 Index
Italy 40 Index is moving towards a resistance line which it has tested numerous times in the past. We have seen it retrace from this line before, so at this stage it isn’t clear whether it will breach this line or rebound as it did before. If Italy 40 Index continues in its current trajectory, […]
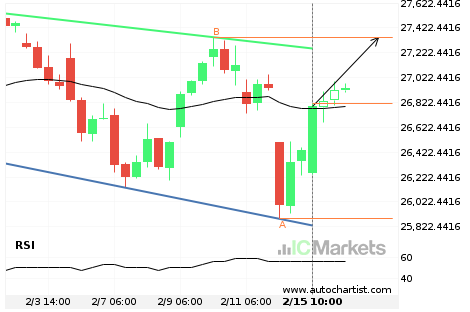
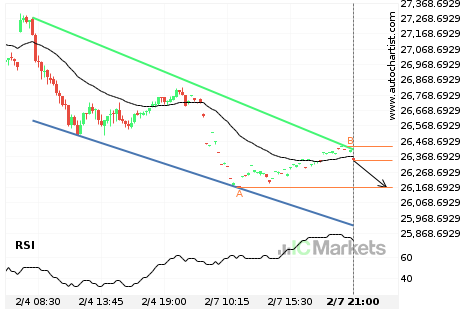
Important price line breached by Japan 225 Index
Japan 225 Index has broken through 26918.0000 which it has tested numerous times in the past. We have seen it retrace from this price in the past. If this new trend persists, Japan 225 Index may be heading towards 26426.5996 within the next 3 days.
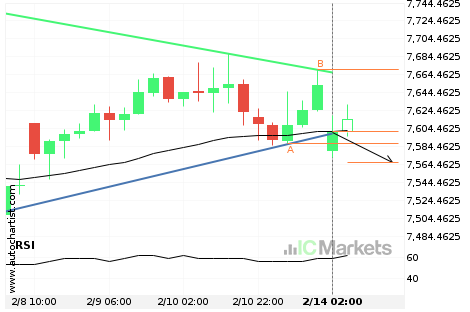
A possible start of a bearish trend on UK 100 Index
UK 100 Index has broken through a support line of a Triângulo chart pattern. If this breakout holds true, we may see the price of UK 100 Index testing 7566.6972 within the next 20 hours. But don’t be so quick to trade, it has tested this line in the past, so you should confirm the […]
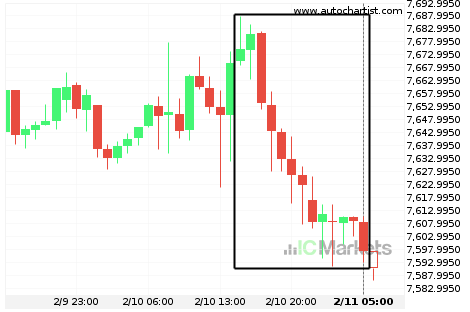
Huge bearish move on UK 100 Index
UK 100 Index has moved lower by 1,01% from 7.670,4 to 7.597,1 in the last 14 hours.
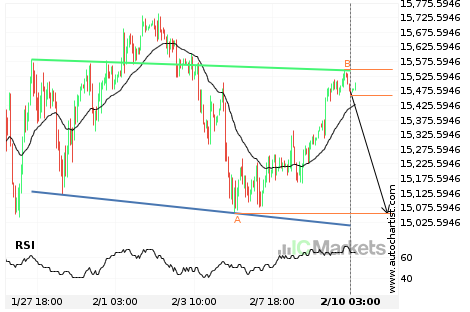
Germany 30 Index – getting close to support of a Cabeça e Ombros
Germany 30 Index is moving towards a support line. Because we have seen it retrace from this line before, we could see either a break through this line, or a rebound back to current levels. It has touched this line numerous times in the last 14 days and may test it again within the next […]
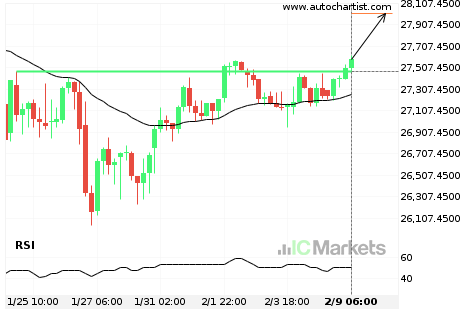
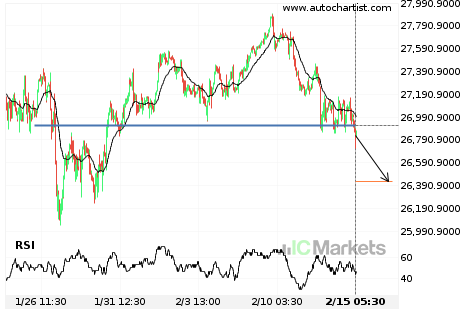
Important price line breached by Japan 225 Index
Japan 225 Index has broken through 27474.0000 which it has tested numerous times in the past. We have seen it retrace from this price in the past. If this new trend persists, Japan 225 Index may be heading towards 28009.0000 within the next 3 days.
Italy 40 Index approaching support of a Canal descendente
Italy 40 Index is approaching the support line of a Canal descendente. It has touched this line numerous times in the last 4 days. If it tests this line again, it should do so in the next 9 hours.
EU Stocks 50 Index – getting close to support of a Cunha descendente
EU Stocks 50 Index is moving towards a support line. Because we have seen it retrace from this line before, we could see either a break through this line, or a rebound back to current levels. It has touched this line numerous times in the last 7 days and may test it again within the […]
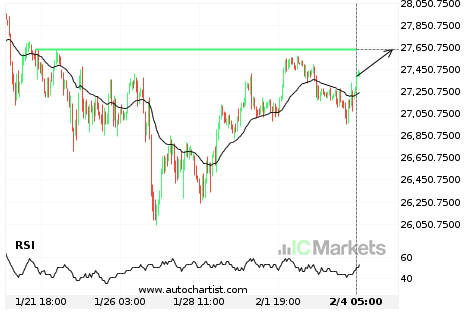
Should we expect a breakout or a rebound on Japan 225 Index?
The movement of Japan 225 Index towards 27631.0000 price line is yet another test of the line it reached numerous times in the past. We could expect this test to happen in the next 3 days, but it is uncertain whether it will result in a breakout through this line, or simply rebound back to […]
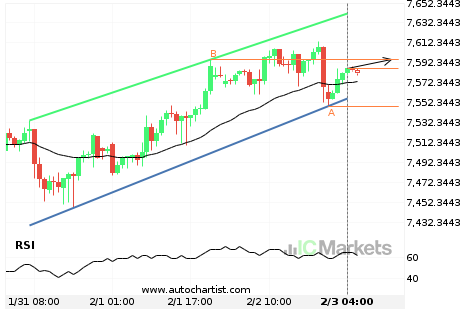
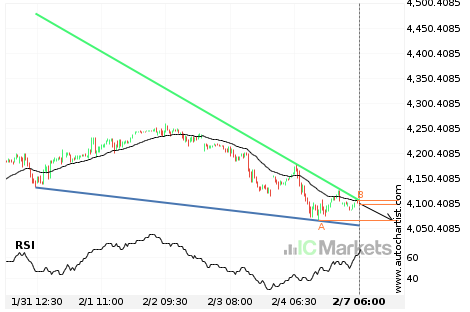
UK 100 Index – getting close to resistance of a Canal ascendente
UK 100 Index is moving towards a resistance line. Because we have seen it retrace from this line before, we could see either a break through this line, or a rebound back to current levels. It has touched this line numerous times in the last 3 days and may test it again within the next […]